Using Syslog while Studying in GNS3 (or indeed and cisco Lab)

I have been getting back in to my studying a lot lately and one thing I have found is the need to use a lot of debug commands so I can watch what is happening during things like routing updates and neighbour formation. One thing I do find though is that I am forever having to turn debug on and off, forgetting to do one or the other, and when it is on it clutters up the screen a breaks up the config I am entering making it difficult to read back.

Which got me thinking, I have used syslog servers a lot in the past, so why not send all the debugging out put to a syslog server and turn of logging to the console? This way I can have all the debugs in one place, and keep the console of the devices tidy so I can see what I am doing.

Now if you are doing this through GNS3 you will need a cloud connection so your PC can talk to your GNS3 network. If you are not sure how to do this there are lots of videos and walk though on the net, however the one below is one of the best I have found, very clear and complete.

How-To: Using the Cloud in GNS3 to Provide Internet Access from Matthew on Vimeo.

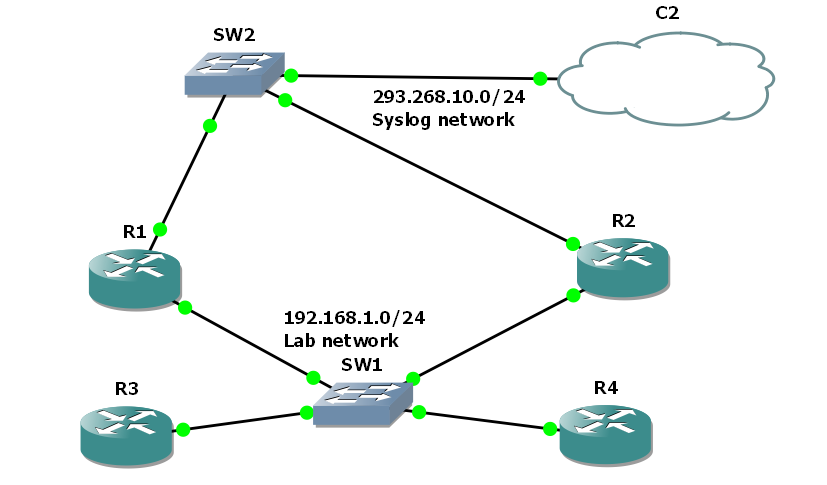
So once you have your cloud set up you then need to set up a simple GNS3 topology, Here I have set up 4 routers running OSPF connected through a switch as I am looking at the DR and BDR election process.

I have given R1 and R2 F0/1 address 192.168.10.10 and 192.168.10.20, and the loopback adapter used by the cloud is 192.168.10.254. Once the routers are booted and connected to the cloud, check they can ping the loop-back address (you may need to disable your fire wall on the loop-back connection.)

then of course you will need a SFTP server, in windows there are two good free choises, for a realy simple server that can run with out install try, http://tftpd32.jounin.net/tftpd32.html simple but does all you need, just make sure you disable dhcp and other none necessaries services in the settings. For a more complete tool try http://kiwisyslog.com/, they have a free syslog server offering that allows filtering and more.

In either case set it up and insure it is listing on the loopback interface, in the case of TFTP32d this is simple a case of choosing the interface from the drop down list.

Finale we need to change the logging setting of R1 and R2 to direct debugging message to the syslog server and not to the console. Remember debug messages are level 7 so we need to set console logging to level 6 or lower and trap logging to level 7. the following code will do just this from global config mode.

#logging 192.168.10.254
#logging console 6
#logging trap 7

So now we can enable the debugging and reset the neighbour relation ships to see what it looks like.

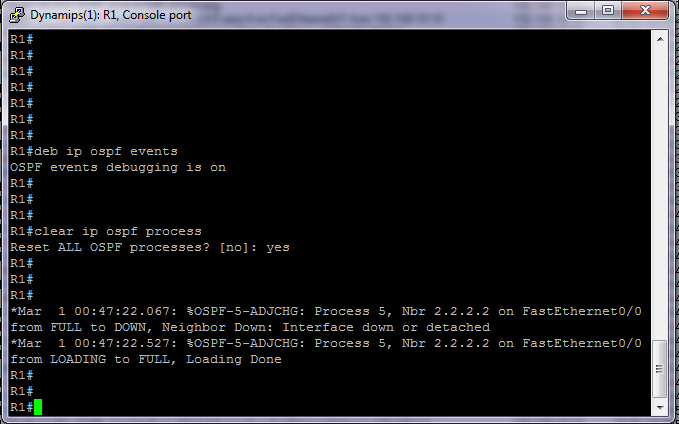
From the console

So not much there apart from we see the neighbours bounce as I clear the OSPF process.

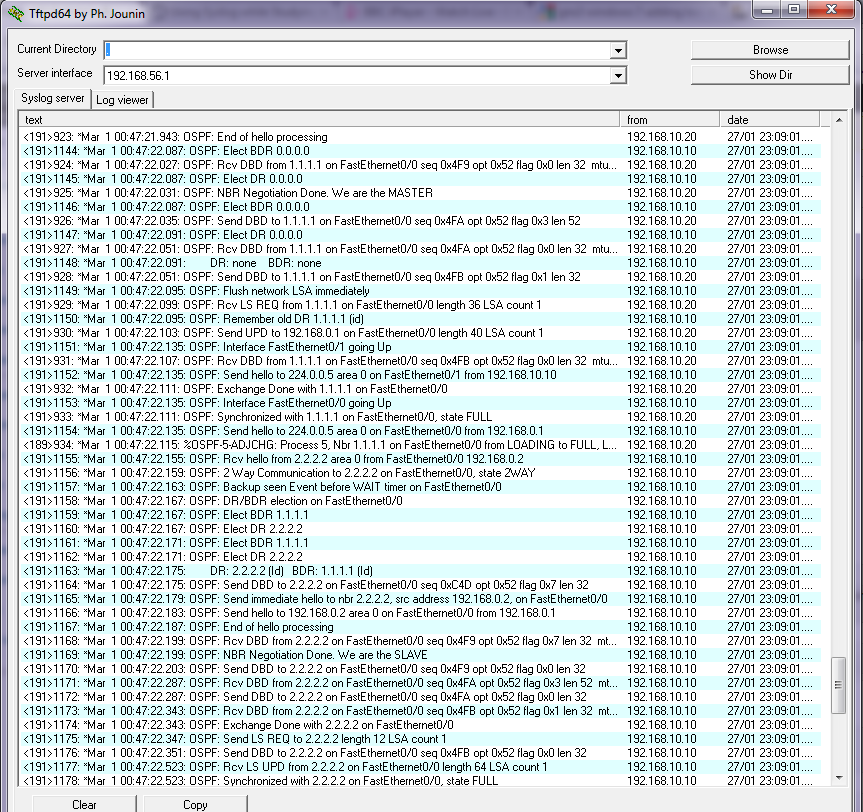
So how about on the syslog server?? 

So here are all our debug messages, for us to scroll through and review at our leisure, If you have something like Kiwicat syslog server you could filer them in to views, based on device that sent it, or text with in message, ect.

You need to make sure of course that you either have the device connected directly to the syslog server network, or it has a route to get there. Directly connected is always best of course as you will insure that as long as that interface on the device is up you will catch all messages. On real hardware simply use a spare switch or create a separate VLAN and do exactly the same thing.

I have found for large labs this works great, indeed for testing setups for clients its great as well. once you have insured the correct debugging is enabled you can walk though test scripts and plans, safe in the knowledge that you have a full detailed log of every thing that has happened.

Simple to set up and hopefully some of you will find it useful.

DevilWAH

Filtering you Logs

I came across this feature today and thought I would share it with you.

The standard way we are taught to set up logging for Cisco IOS devices is something along the lines of,

(config)#logging buffer 5
(config)#logging trap error

where you state where you want to log to and then what level of messages you wish to log in the range 0 to 7, with 0 the most critical and 7 debug messages.

This is all fine until you find you want to log a specific alert that is informational (level 6), but you don’t want to log every level 6 event that happens. My example of this was I wanted to log a specific ACL match but not link sate or other notification level alerts (ACL’s log at level 6 / informational by default).

Cisco in there wisdom have though of this for us and given us the “discriminator” command to allow us to manage logging in more detail. The outline is that we can create a named “discriminator” that will filter out / capture events based on things like the facility, the mnemonics, a string with in the msg-body, or the severity level. This can then be used in further logging statements to determine what happens to these messages. So lets have a quick example to see how it works. As I said in my case it was an ACL I wanted to log from so lets go for that.

First we can set up an access list with a logging statement in it and assign it to an interface

(config)#ip access-list extended ACS_Critical
(config-ext-nacl)#permit ip any any eq bootps log
(config-ext-nacl)#permit ip any any
(config-ext-nacl)#exit
(config)#int vlan 888
(config-if)#ip address 192.168.5.254 255.255.255.0
(config-if)#ip access-group ACS_Critical in
(config-if)#exit

So we now have an access list that will log any DHCP traffic received coming in on the VLAN 888 interface, In my cace VLAN 888 is a critical VLAN that client pc’s will end up in if there are problems with network authorisation. So testing for DHCP traffic will let me know if the VLAN is being used and therefore if there is a authorisation issue. (last line of checking)

As I said before though ACL’s log at level 6, but if you watch a switch you will see a lot of lthese messages appearing in the day to day running of the switch and most of them you don’t need to worry about. Generally I would only save to buffer and forward to a syslogging server any level 5 (notification) or higher messages. But I do want to see the ones from this ACL…. We can set it up to do this as below

(config)#logging trap 5
(config)#logging discriminator ACS msg-body includes ACS_Critical
(config)#logging host 192.168.5.50 discriminator ACS

The Trap statement sets the default level for logging to the syslog server, the logging discriminator creates the discriminator called ACS and will filter incoming events for a message body containing ACS_Critical (name of the access list), and we then apply this to the syslog host when we set it up. Now all the default level 5 – 0 events will be logged plus the specific ACL’s generated ones.

A single host can have one discriminator assigned to it, but this can have multiply statements, and much like an access list these can allow or deny event to be passed, the commands are “includes” as used above, or “drop” to prevent a message getting logged. I find it especially useful for filtering logging to the syslog servers, as these log files can get huge if you are not careful.

Attached here is a CISCO document with more examples of setting this up.

Hope you found that intresting, and now I’m of to the seaside with wife and baby for a few days to fly my new kite 🙂 have a great weekend all.

DevilWAH

PS. I promise once I get back I will be getting on with my CCNP ROUTE posts as I said I would. Just been a busy week that I will tell you all about soon. I have also been asked to set up a web server and a few other projects so time has been tight. But I have had time to do some reading. I think I will start of with a review of sub-netting before I hit ROUTE core topics.